Charts and analysis
Updated 18 October 2026
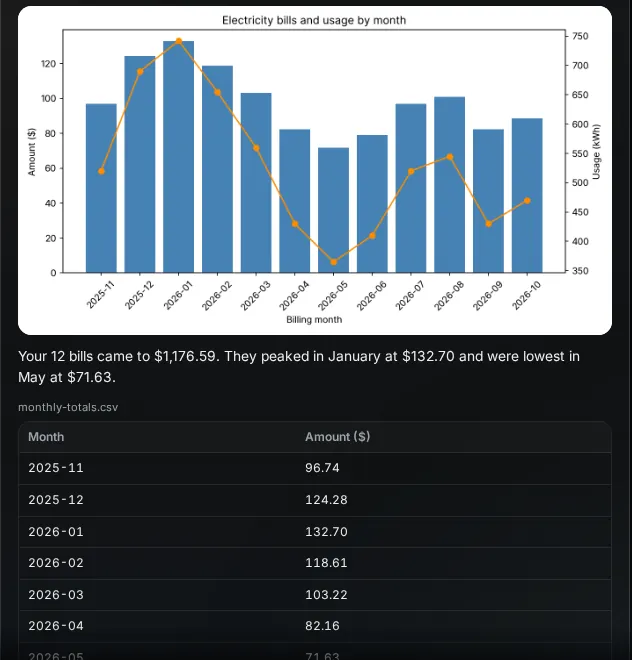
"Chart my electricity bills by month" with a CSV attached: PelQi works through the numbers and brings back a chart, a table and a short summary on a card in the chat.
Charts and analysis come with PelQi Plus, Family and Max.
Ask for a chart
- Attach the file (a CSV or Excel sheet works best) using + in the message box, or use a file you already sent in this chat.
- Ask for what you want: a chart, a total, an average, the highest month.
- A card appears with the chart, a preview of any table, and a summary. Download the chart or the full table from the card, or choose Open beside chat to see it larger.
What it can and cannot do
- The numbers are worked out by running code in a sealed space on Anthropic's side with no internet access. Your files are sent there for the run and deleted from Anthropic's file storage when it ends.
- PelQi never invents data: if the file does not contain it, PelQi says so.
- It brings back charts as pictures and tables as files you can download, up to six from one run.
- Plus and Family: 10 analyses a day each. Max: 60 minutes a day. Each one also uses your daily chat allowance. Free and children cannot run analyses.
- Pictures you attached are not part of an analysis.
If it does not work
- The chart is wrong or messy: say what to change ("only 2026", "as a line chart").
- It stopped: an analysis stops after four minutes. Try a smaller file or a narrower question.
Still stuck?
Email info@fortisdatagroup.com with what happened, what you expected and the device you use (for example, iPhone app, or Chrome on Windows). A person reads every message and answers within two working days. Never send a password or a code.
Common questions are also on the support page.